FX European-Commodities Mean Reversion Strategy
End-to-end process on how I developed a mean reversion strategy, and thought process behind it
Setup
I was reading this book; Finding Alphas: A Quantitative Approach to Building Trading Strategies and got an idea to explore mean reversion in FX. I already have a few mean-reversion ish type of alphas in my overall FX strat, but it wouldn’t hurt to explore a new one.
In chapter 4, the example of alpha given is
Alpha = -(close(today) - close(5_days_ago))/close(5_days_ago)
In plain English it means to go long assets which has posted negative 5 day returns, and vice versa. Note: this is not the alpha that I used for the strategy below, but it is influenced by the above.
Seeing the alpha formulation reminds me of @macrocephalopod’s tweet:
@DeusCapital It’s just that cointegration relationships are neither necessary nor sufficient for successful stat arb trading … so why bother with it at all?
— cephalopod_v7 (wirefraud (parody)) (@macrocephalopod) 6:42 PM ∙ May 26, 2022
I still remember when I first read that tweet, it made me rethink my approach to stat arb. And hopefully this post will show that you can run a stat arb strategy without any cointegration/ADF test(?)
Anyways, as usual practice I split the dataset to training set and test set. Training set is 2000-2015 and test set is 2016-2022. I only give myself one attempt on the test set; it means that any adjustment I want to make with regards to the strategy has to be done using the training set.
Understanding the strategy
After calculating the alpha score for each currency, it is tempting to just check how much money it makes. But first let’s check whether the strategy behaves like a mean reversion strategy. We can plot the position (alpha score) and the price level as visual check.
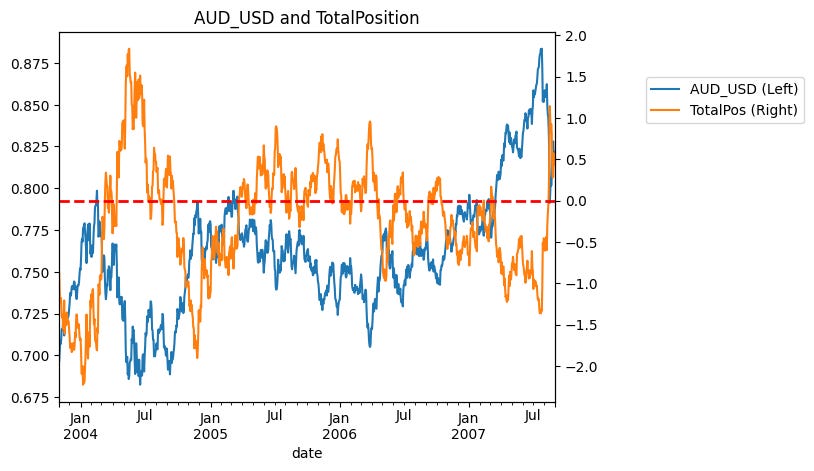
When the orange line is above the red dashed line (0), our alpha score is positive means that we are long, and vice versa. As we can see that our alpha score seems to move inversely with the price level, which is consistent with a mean reversion behavior (buy the dip sell the rip).
Now let’s approximate the turnover. We can calculate the average days it take for our position to flip signs.
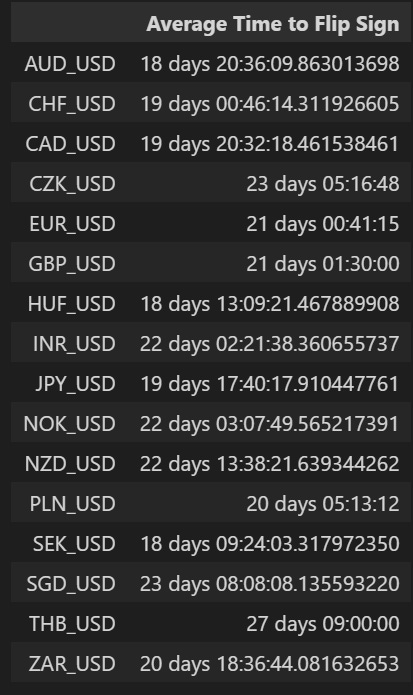
It looks like it takes around ~20 days for us to flip from long to short and vice versa, that seems quite reasonable for mid-frequency mean reversion.
Our position will just be the alpha score divided by the rolling 1 month volatility.
Performance
Let’s look at the performance of the strategy.
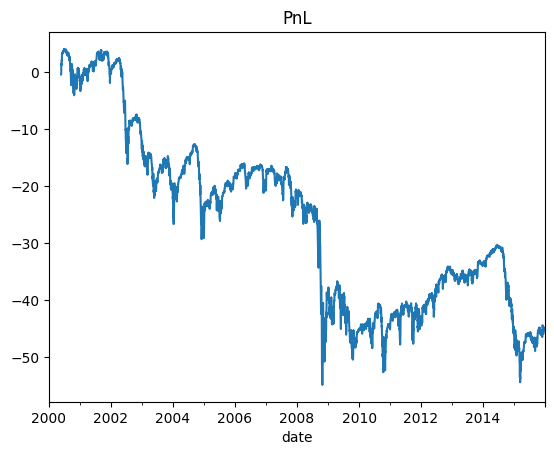
Sharpe = -0.288
Not encouraging at all. Now it got me thinking maybe we should do it cross-sectionally instead of time-series based. Maybe the relative level of mean-reversion score that matters instead of the absolute level.
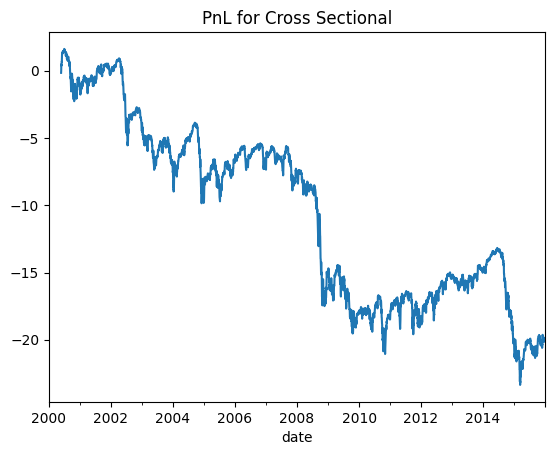
Sharpe = -0.399
Still not encouraging. I could just flip the sign and treat it as a momentum strategy but I’m not gonna do that here. I still have some ideas to test for a mean reversion strategy.
Finding mean reversion between groups
At this point it got me thinking, maybe I can put these currencies into multiple groups, and then trade mean reversion between them. There are some natural currency groupings that are obvious for example DM, EM, Asia, Commodity, European, Eastern Europe, and many more.
For this experiment I wanted to try Commodity vs European. Why you might ask? To be honest it is purely a discretionary call. Long story short in the past I worked with building an intraday mean-reversion FX using clustering/PCA techniques, and some of the clusters can be interpreted as Commods and Euro. Rob Carver calls this implicit fitting, and I pretty much agree with it. But it would be quite ridiculous to not utilise domain knowledge here; if not we might as well use random groupings of the currencies.
Commodity Currencies = ['AUD_USD', 'NZD_USD', 'CAD_USD']
European Currencies = ['EUR_USD', 'CHF_USD', 'SEK_USD', 'NOK_USD',]
(I’m only using G10 here for cleaner groupings)
Some might argue NOK should go into the commodity basket, again it is my discretion here to put in the European basket. I mean people might argue whether it is a commods currency or not but no one will argue whether Norway is in Europe or not.
Updated Rule
Using the mean reversion alpha score for each individual currency above, I will calculate the alpha score for each group taking the mean of the scores of its members. And then I will take the difference of the group alpha scores to determine which group will be longed/shorted. If alpha score of commods > euro, we go long commods short euro (vol-weighting each member) and vice versa. Note: Also since we have more european ccys than commods ccys, we need to remember to adjust for that in the position size to make it pseudo-USD neutral.
Now let’s look at the performance. The portfolio performance is the thick black line.
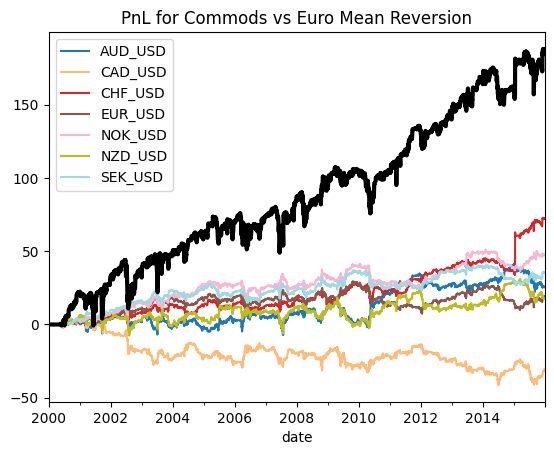
Sharpe: 0.48
Looks like we might be onto something here! All currencies seem to generate positive returns, except for CAD. Some might argue CAD is kinda an outlier and doesn’t really belong in the same basket as AUD and NZD. So let’s remove CAD from the basket and see what happens.
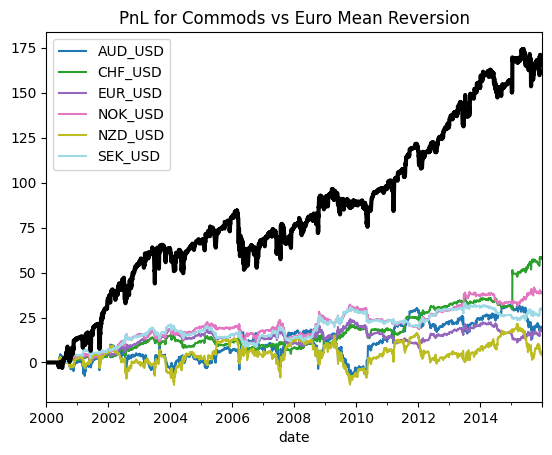
Sharpe = 0.538
That’s quite a significant improvement in Sharpe. Going forward I will not include CAD in the commodity basket.
Thoughts on overfitting
Some might accuse me of overfitting since I made changes after seeing the performance. To those my arguments would be: 1) The changes I made have economical backing (to certain extent) that I'm personally comfortable with, 2) All the changes are made in the training set, I have not touched the test set yet.
Final Performance
The moment of truth is finally here. I’ve finalized all my rules and instrument choices, after this I don’t allow myself to make any changes anymore. Let’s look at the out-of-sample performance of the strategy.
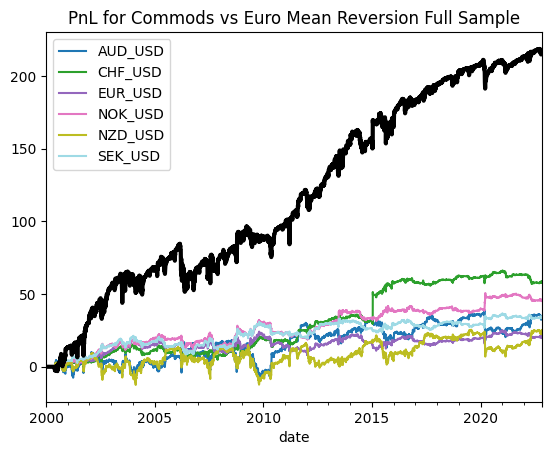
Sharpe (Full Sample) = 0.56
Sharpe (OOS; 2015-2022) = 0.794
Now let’s look at a very crude attribution method (Tilting vs Timing over 1y horizon, stolen from the tweet below)
@witchqueendot @bauhiniacapital @thodoha I used to look at a breakdown that I called “tilt vs timing” where the “tilt” strategy would be the average position in each asset over a given time period and the “timing” strategy is the residual to this (by definition the strategy has time-series mean zero)
— cephalopod_v7 (wirefraud (parody)) (@macrocephalopod) 8:42 AM ∙ Dec 27, 2022
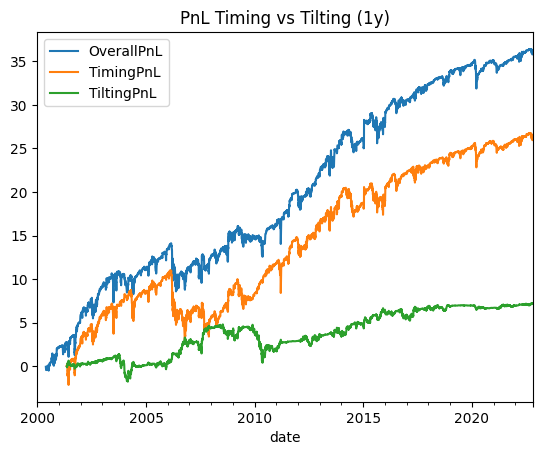
Sharpe (Overall) = 0.56
Sharpe (Timing) = 0.43
Sharpe (Tilting) = 0.28
I’m pretty much happy to see that the OOS performance holds up. Next steps is to look closely at the return profile, drawdown, skew, more attribution etc. I’m not so concerned about the strategy’s cost in isolation since I control for the turnover/cost in my portfolio construction workflow. But for now that should conclude the post. Thanks for reading, any feedback and comments are welcomed!
Additional Thoughts: Discrete vs Continuous Trading
Most of you would have realised that my positions are not discrete (binary long/short), rather they are sized proportionately to the alpha score. Real talk, the move from discrete to continuous trading system has been the biggest gamechanger in the way I approach trading. It completely bypasses a lot of issues I had with discrete trading system; entry/exit level, stop losses etc. Many practitioners have written about this issue, so I will leave you the links below to their writings. I will just show the performance of the strategy above if I had use discrete trading system.
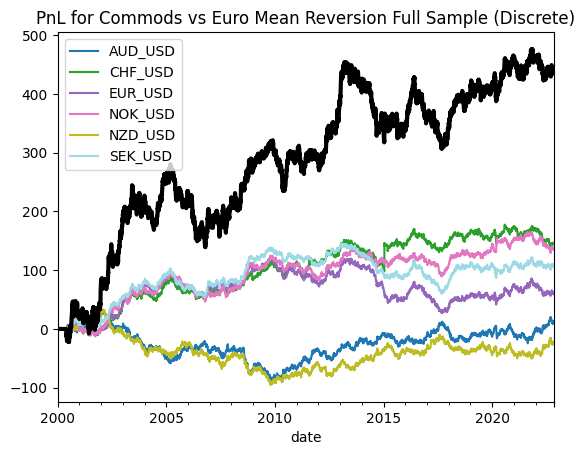
Sharpe = 0.388
Much inferior compared to the continuous version.
@macrocephalopod’s tweet
@richkleedotxyz @M1tchRosenthal I think what happens is that amateur traders prefer to think in terms of entry/exit than target positions. So they take continuous signals and discretise them, and when the value of the discrete signal changes they call that an “entry” or an “exit”.
— cephalopod_v7 (wirefraud (parody)) (@macrocephalopod) 10:22 PM ∙ Jun 10, 2022
Rob Carver’s writing:
https://qoppac.blogspot.com/2020/07/do-non-binary-forecasts-work.html